- - CW500
CW500 POWER QUALITY ANALYZER
제조사 : YOKOGAWA
제품명 : CW500 전력(분석)계
제품번호 : CW500
제품분류 : 전력(분석)계


제품상세정보
|
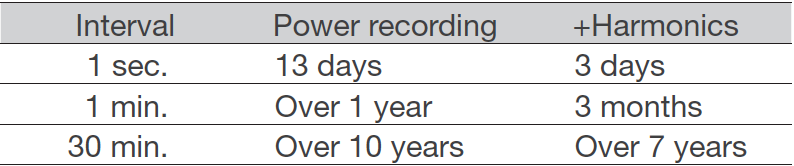
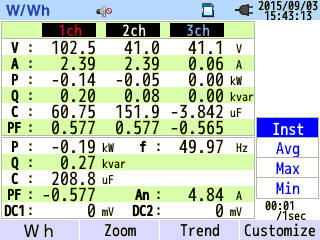
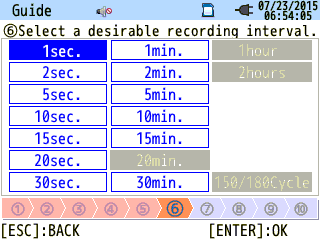
Power line and Input Channel: 3 CH Voltage, 4 CH for Current Clamp Probe. 1P2W (up to 4 systems), 1P3W (up to 2 systems), 3P3W 2current (up to 2 systems), 3P3W 3current, 3P4W Power measuring item: Instantaneous, average, maximum, and minimum values for each setting period: Voltage/Current/Power (Active, Reactive, Apparent)/Power Factor/ Phase Angle/Frequency/Calculated Phase Shift Capacitance/DC voltage value 2 CH. Integration Value Energy (active, reactive, apparent), Demand (list or graph display of change in a specific period and as a whole) Recording Interval Period 1/2/5/10/15/20/30 second, 1/2/5/10/15/20/30 minute, 1 hour/2 hours Recording method Manual, time, period Estimated Recording Length with 2 GB SD card
* The recording length shortens according to the number of power quality events. * Only the included SD memory card or dedicated SD memory card is guaranteed. Various Measuring Screens List display, zoom display by 4 or 8 divisions, trend graph display, integration value display for energy, demand list display of value, demand graph display for change of period, demand graph display for whole recording List Display Items of measured values can be selected with the curser key.
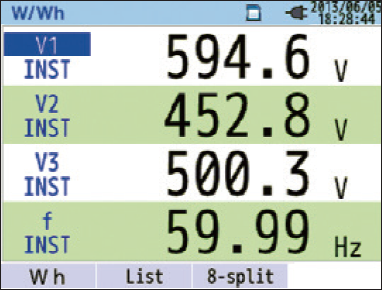
Zoom Display Zoom display can be selected by 4 or 8 divisions.
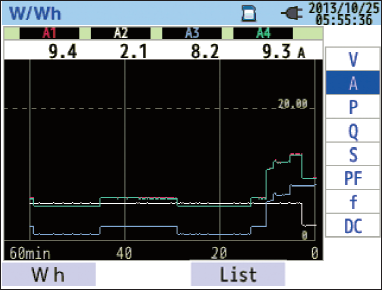
Trend Graph Trend graph of voltage/ current/power/power factor/frequency/ advanced phase condenser external DC voltage.
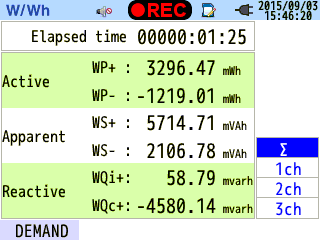
Energy Display List of active, apparent, reactive by consumption or generation.
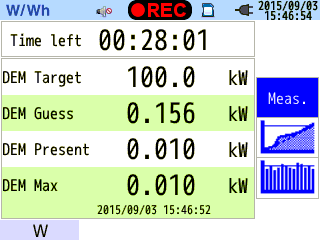
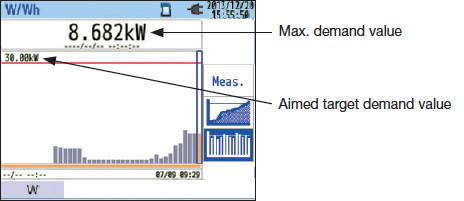
Demand measuring Demand is the average power value of a specific period (usually 30 minutes). The contract with the power supplier conditionally concerns the maximum average power value between a period for the consumption fee. This function supports how to maintain within the target consumption by monitoring the estimated demand value to the setting rate with the maximum demand value. List of Demand Value
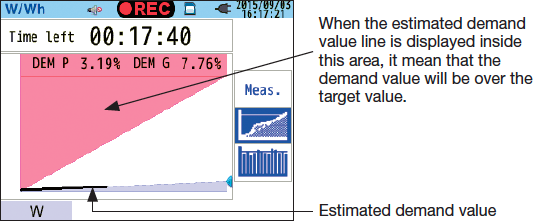
Graph display of change on specific period
Graph display of whole demand trend
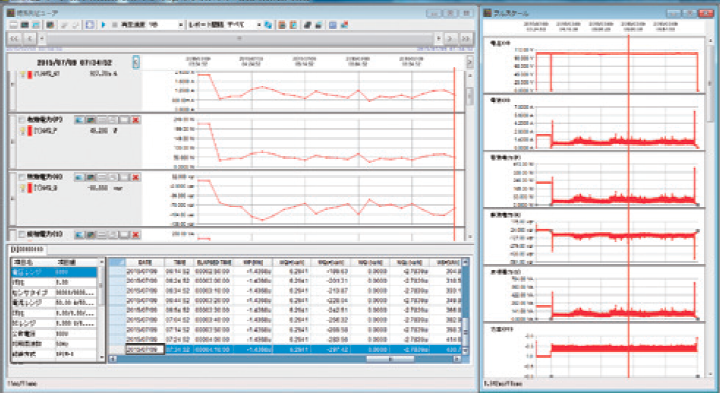
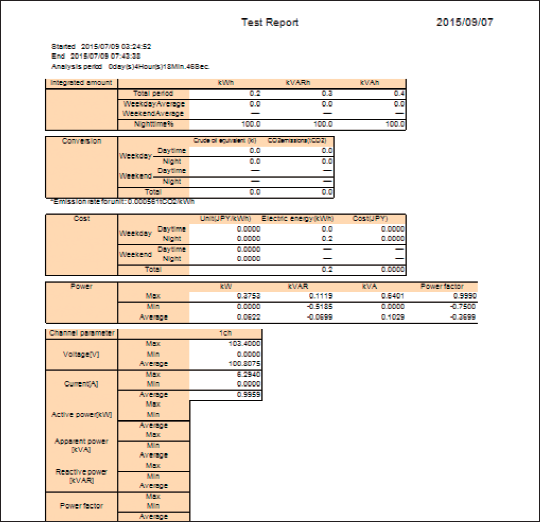
Analysis and Reporting of recorded data Analysis and reporting is enabled by simply clicking on the desired data on the software screen. Analysis can be viewed by trend graph, overage, maximum and minimum value of voltage current, power, and power factor. Report generating can be set daily by daytime, nighttime, working day, or off day. It can also be set on a monthly period based on daytime or nighttime, working day or off day. Additionally, energy data to quantify into crude oil barrels or CO2 can also be converted. Trend analysis graph
Sample of report
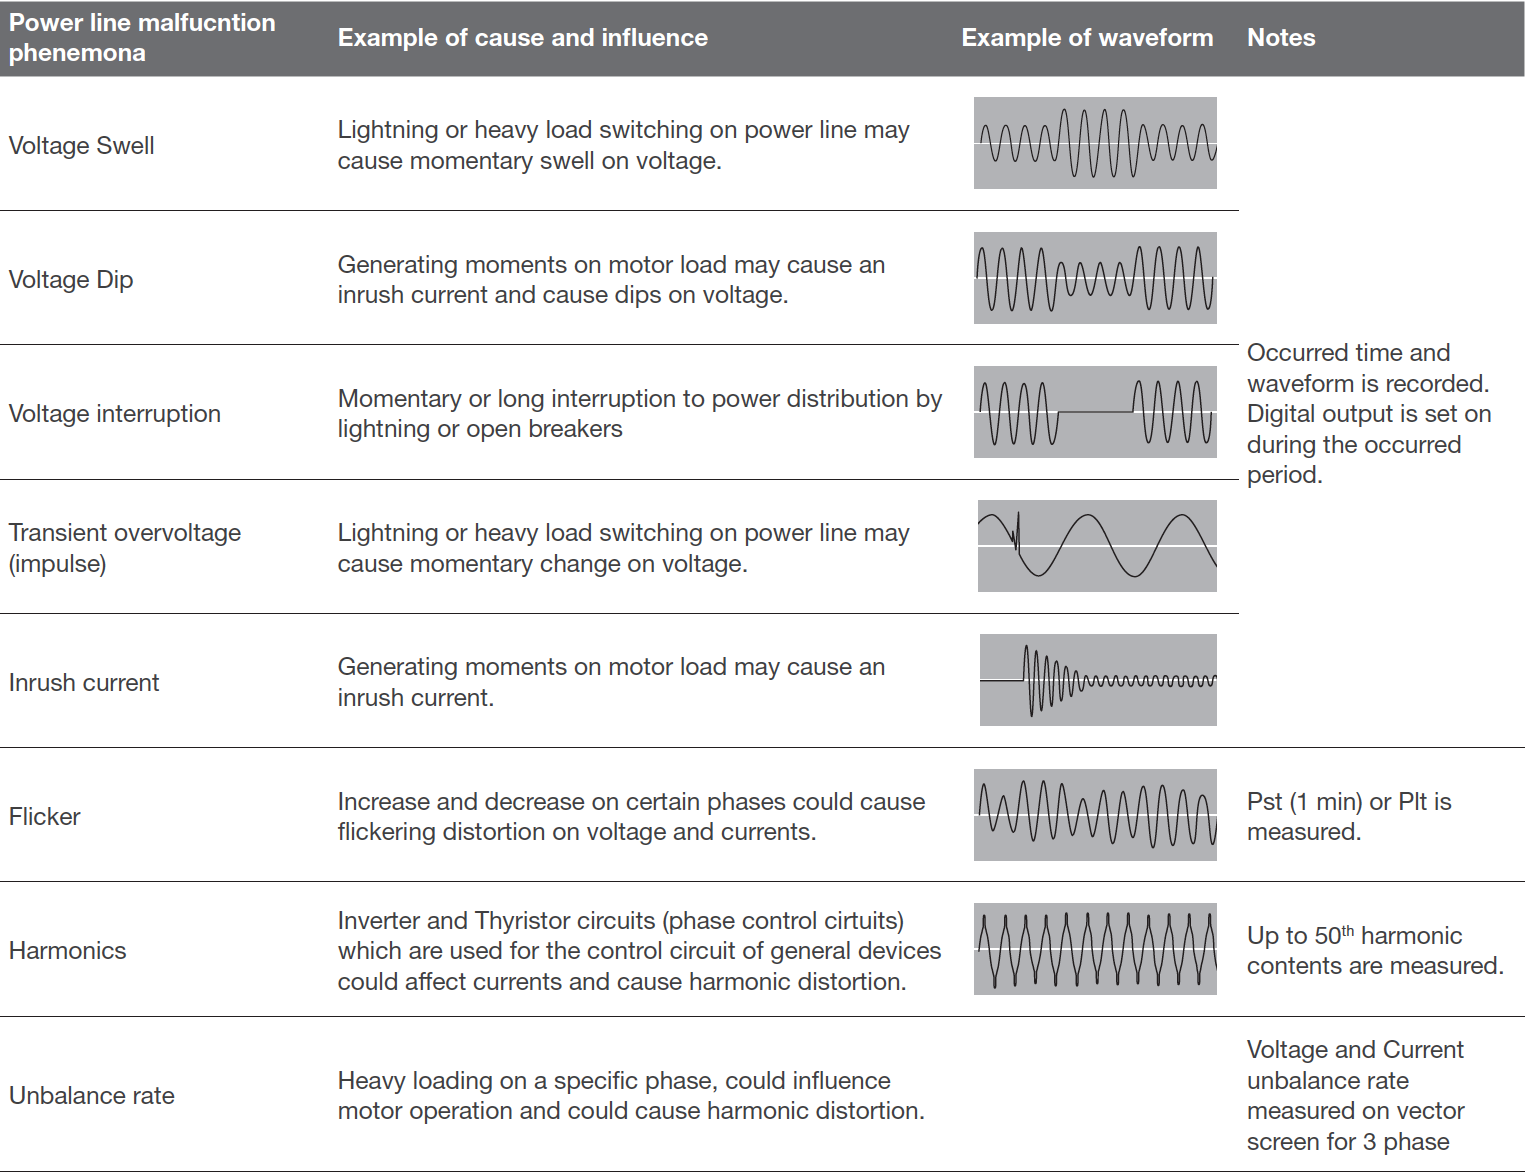
Power Quality Function Short period power line malfunctions such as voltage swells, dips, interruptions, transients, over or inrush currents, or long periods of harmonic distortion/flicker may damage or reset your devices. The CW500 helps to identify each of those short period malfunctions by recording occurrence time, occurrence finish time and waveforms. Additionally there is a digital output on occurrence. Long period malfunctions can be analyzed by harmonics, flicker, waveform, or by checking on the unbalance rate calculation for a 3 phase measurement. All data can be finalized into a report format with the included software. The CW500 conforms to the IEC standard of 61000-4-30 Class S.
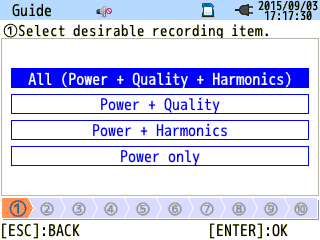
User Support Function User Friendly Quick start guide and automatic type of clamp recognition The quick start guide will show on-start measuring and how to wire and set the range before measuring. The automatic clamp detection will insure the settings are correct. Start of guidance PUSH the “START/STOP” key. Select “Quick start guide”. Select recording item.
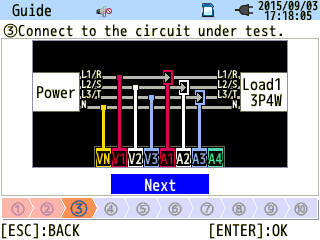
Wiring Select the wiring and the appropriate connection diagram will be displayed. Connect accordingly.
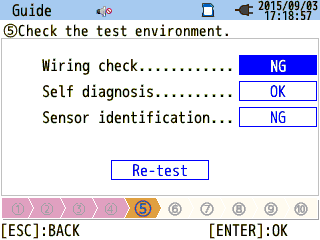
Wiring check/self diag./self id. Wiring check, self-check and the type of clamp is automatically detected and the results displayed. If NG is displayed, the detail can be confirmed by pressing the “ENTER” key.
Recording setting Set the recording interval time and the recording time or period.
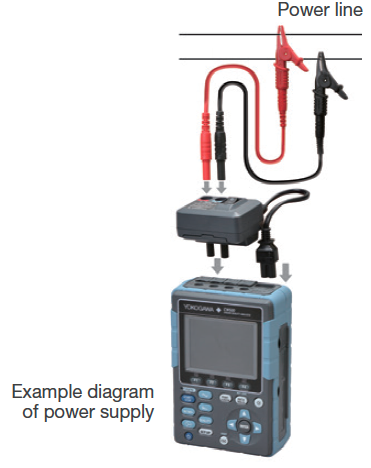
Power supply from measuring line Power (under 240 VAC) can be supplied by using the power supply adapter (sold separately).
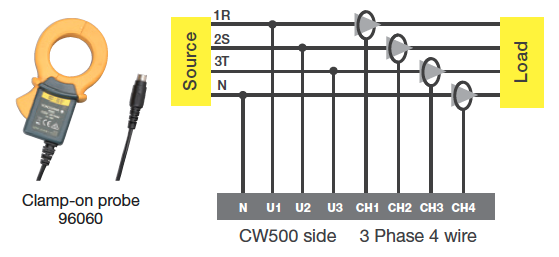
Note: This is not available for EV region. Leakage current measuring The external magnetic field effect is 0.002 A or less, at 400 A/. Yokogawa’s proprietary technology has achieved a magnetic field impact amount of 30 ppm even in adjacent power lines (at 100 A). Below is an example of how to measure a neutral line of 3 phase 4 line.
Multiple line measuring 4 system load measuring Maximum of 4 systems are capable for 1 phase 2 line wiring. Maximum of 2 systems are capable for 1 phase 3 line or 3 phase 3 line wiring. |
제품정보
POWER QUALITY ANALYZER
Prtable Power Meter
상품정보 모델명 CW500
Load
제품소개 > Power Measurement and Logging
> Power Quality Measurement
> User Support
> Analysis of Data and Report Generation